
How Benjamin Cowen’s $130 a month Risk Model Got Destroyed by a Free, Basic Trading Indicator
The surprising results of a simple, public test.
A free trading strategy - the kind you could build in two minutes with zero coding and no subscriptions - just outperformed a $130/month crypto model that’s built on a foundation of logarithmic regression curves, aggregation of multiple types of trading data - from price to on-chain to social media, and normalization, and is subscribed to by thousands of people who trust it to gain an “edge” over other crypto traders.
This note breaks down an experiment that we here EdgePhase were curious to run, after watching a number of Ben Cowen’s videos on Bitcoin.
Cowen is one of crypto’s most visible data influencers, and the founder of the retail crypto analytics company, Into the Cryptoverse
We decided to ditch the complexity of Ben’s risk model whilst simplifying one of Cowen’s own “indicators”- the “Bull Market Support Band”, BMSB into something more usable. The BMSB is the plot of 2 moving averages: 20-week SMA and 21-week EMA.
By simplifying the BMSB to the 140-day simple moving average (SMA), and deriving our trading signals from that, and that alone - Baby’s First Trading Strategy was born. So called because of its simplicity to implement and follow.
The result? The free strategy didn’t just hold its own. It beat Cowen’s Model - in both total returns and trade consistency - all using public data, simple logic, and no black-box wizardry. And it wasn’t even close.
There’s a lesson here.
Too many traders pay for a seat at the Theatre of Complexity - systems that sound smart but don’t actually improve their outcomes (and indeed, can lead to worse outcomes). Just because a strategy costs a fortune, uses Greek letters and regression math doesn’t mean it works.
Let’s walk through what we tested, how it was built, and why this matters - not just for beating one model, but for challenging the entire idea of what “smart” trading systems really look like.
The Benchmark: Cowen’s Risk Metric
What it claims, how it works, and what it costs.
To measure the performance of a “smart” paid system, I chose one of the most widely referenced crypto models in the space: Ben Cowen’s Risk Metric, sold as part of the Into the Cryptoverse (ITC) platform.
If you’ve spent any time on YouTube, you’ve probably heard Cowen explain how his system works. Publicly, he describes it as a way to assess market conditions through the lens of “risk.” When prices are euphorically high, the model shows elevated risk. When prices are depressed, the risk score drops - signaling opportunity. That’s the basic pitch.
Under the hood, the system is built around logarithmic regression curves that track long-term growth bands. But that’s not all. Ben also folds in other variables like on-chain metrics, volatility indicators, and even social sentiment, which are then aggregated and normalized into a single “Risk Score” between 0 and 1.
It’s the kind of model that sounds impressive - and it’s marketed that way. It's also easily digestible because the scores always fall between 0 and 1, nice numbers that we can get our heads around.
But here’s the problem: when you pay $130/month for a trading tool, it shouldn’t just sound smart. It should perform. The entire purpose of the ITC Risk Metric is to help long-term investors avoid the top, buy near the bottom, and stay safe in between. It’s meant to act as a guidance system for timing market entries and exits over multi-year cycles.
So that’s the benchmark.
A paid, data-driven product built by someone with a massive audience (890k subscribers on YouTube and 1m followers on X) - marketed explicitly as a smarter way to ride crypto cycles.
And as we’ll see… Cowen’s $130/month Risk Model didn’t just underperform Baby’s First Trading Strategy. It got destroyed by it.
The Challenger: 140-Day SMA Crossover Strategy
One simple rule. No buzzwords. No. BS. Just results.
To put Cowen’s $130/month Risk Model to the test, we wanted a challenger that was as brutally simple as possible. No bells. No whistles. Just a rule — and the discipline to follow it.
So here it is:
· Buy Bitcoin when the price of Bitcoin starts the day below the 140-day Simple Moving Average (SMA) and closes above it.
· Exit when the price of Bitcoin starts the day above the 140-day Simple Moving Average (SMA) and closes below it.
No log regression. No multivariable aggregation. No “normalized composite scores.” Just a price line and a simple moving average.
This is what most people would consider a basic trend-following system. It’s been around since traders started plotting prices on charts. You’ll find versions of it in books from the 1980s, backtests on TradingView, and institutional quant models alike. The difference is, most people don’t follow it. They overthink. They overtrade. They add noise. We didn’t.
The Logic:
The 140-day SMA was chosen simply because, Cowen himself references it through the Bull Market Support Band, BMSB. We just simplified it; instead of adding the exponential moving average - we removed it. And to have more granularity, we converted the weekly moving average into its equivalent length daily moving average.
Methodology.
Entering the Market with Cowen:
A linear approach to dollar cost averaging, DCA-ing, such that when Cowen’s Risk model shows these values, we DCA the following sums for that day:
0.4 - 0.499, invest $50, 0.3 - 0.399, invest $100, 0.2 - 0.299, invest $150, 0.1 - 0.199, invest $200 and when risk is 0 - 0.099, invest $250.
Per the image below, x = $50
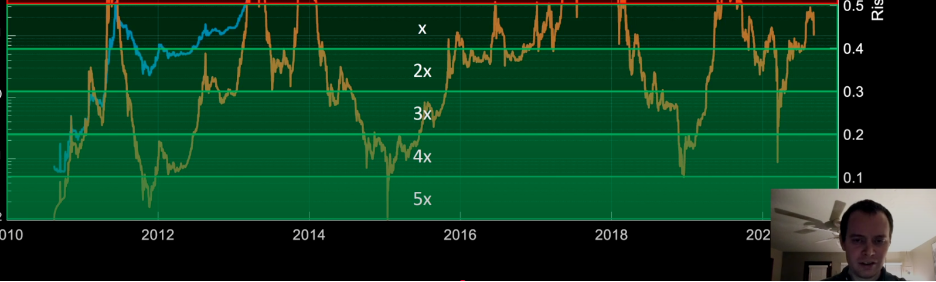
Screen shot taken from https://www.youtube.com/watch?v=gzURqQtFfw4&t=369s
Exiting the Market with Cowen
Cowen's model offers us six different levels of risk- taker. Each level of risk- taker maps to a different risk level at which the investor would start taking profit and exiting from open positions. To make things as realistic as possible, we chose the “Aggressive” profile, taking profits when we hit the middle of each sellable risk band, and exit in a linear fashion.
In other words, we are middle-of-the-road investors here. Middle profile, sell in the middle of the risk band and sell linearly.
We exit based on the following rules:
When risk hits 0.65, we sell 10% of our position. At 0.75, its 20%. When risk hits 0.85, it’s 30% and then we will have totally exited our position by the time risk hits 0.95, upon which we offload the remaining 40%. 10, 20, 30, 40; linear scaling out of our position.

In this screen shot, you can see what exit strategies would look like if investors exited at the top of the risk bands. We chose to exit at the middle – which is a more conservative approach than the one shown here by Cowen. https://www.youtube.com/watch?v=ReziClqylXA
The whole point of Cowen’s model is to balance risk and reward – to DCA into Bitcoin (or any other asset) when risk is low- which is to say that the risk score is closer to 0, and take profit as risk increases- which is to say that the risk score is closer to 1.
Entering the Market with Baby’s First Trading Strategy
Clearly there is a difference in entering and exiting the market depending upon whether following Baby's First Trading Strategy or Cowen's Risk Model. With Cowen's Risk Model, you're DCA-ing based on the risk levels and pre-determined sums of daily capital. With Baby, buys and sells are triggered on the buy and sell signals that are generated on crosses and closes above and below the 140-day SMA.
So, to make this a fair fight, every time we get a buy signal on Baby, we see how much money has been invested in Ben's strategy at the same point. We then inject the same amount of capital into Baby. This means that any time a buy signal is flashed and a buy trade is executed with Baby, we're always working with the same amount of capital as we have in Ben's strategy. These are referred to as “additional tranches” (See “How To Run This Experiment For Yourself” at the end of this note.
Notes
Data Sources: Into The Cryptoverse – for Cowen’s historical Risk Model values, TradingView. Note: EdgePhase will not publish any data that came directly from Ben Cowen's paid subscription service. It sits behind the paywall and it's not right for EdgePhase to publish it for free.
Assets Tested: Bitcoin (BTCUSD)
Start date: September 20 2019 – the date that Cowen released the first video on his YouTube channel
End date: March 10 2025
For Baby’s First Trading Strategy:
Trade Logging: Every crossover was logged - both entry and exit dates. No guesswork.
Full Allocation Per Trade: Each position assumed 100% allocation (for simplicity). No dollar-cost averaging, no partial exits.
Returns Measured: Trade-by-trade gain/loss recorded and compounded. No leverage used.
No Manual Overrides: The strategy was purely mechanical. No subjective filters, gut calls, or chart pattern interpretation.
Implement a 15bp (0.15%) trading fee for each trade conducted, because this makes the experiment more representative of the reality of following these strategies
We use a “Blindly DCA” approach as our control method. Where, once the test has been conducted, we analyze the total invested, and divide this by the total number of days from the start to the end of the experiment sample period. This gives us an ex post daily DCA $ value to be invested – regardless of the price of the BTC. We invest that money every day, without fail.
Hypothesis
We wanted to implement exact opposite of a “narrative-based” system. It didn’t need a YouTube explainer or hundreds of hours of videos on market theory. Either the price was above the line, or it wasn’t. End of story.
Our hypothesis was that Cowen’s model, under the rules of the experiment as defined above, deliver us:
1. More banked gains than Baby’s First Trading Strategy
2. A smaller maximum drawdown than Baby’s First Trading Strategy
Why? Because Baby’s First Trading Strategy is a single free indicator. A single rule. And no monthly fee of $130.
The Results
We can break this down into three sections, in which we will explore the graph that encompasses all data relating to total portfolio values, a table which gives us the raw headlines and a bar chart which brings everything together.

The green line finishes above the red line. Baby’s First Trading Strategy beat Ben Cowen’s $130/ month Risk Model.
Here’s that end section zoomed in:

Observations:
· Pick any point in time after Nov 13 2022, and Baby’s portfolio value is greater than Cowen’s
· The “Blindly DCA” control line is remarkably close to Cowen’s at the end of the sample period. We will see more of this later
· As expected, visually, we can see that the Blindly DCA approach had significantly larger % drawdowns than Cowen. This was to be expected. However, it also had much larger % drawdowns than Baby - which we might not necessarily have expected.
· In the heightened period of volatility that the crypto market has experienced since Feb 2025, Baby has largely sat that out, having exited and banked all its gains, sitting in cash for each day since Feb 25th 2025, apart from one day.
Conclusions
· Given that Baby outperformed Cowen’s model every day for nearly two and a half years is evidence That Baby has a structural advantage and a long-lived edge over Cowan's model. This was no “winning by a narrow margin on the final week of the experiment” kind of victory. This was consistent outperformance, for 848 consecutive days.
· Blindly DCA-ing manages risk less well than either Cowen or Baby, but has a final portfolio value that is close to Cowen’s. We will address this more fully below.
· Baby has shielded itself from market volatility in the final few weeks of this experiment, having exited and sat in cash.
· Whilst we can see that Baby’s portfolio value finished higher than Cowen’s portfolio, we do not yet have enough evidence contained in this chart alone, to validate or invalidate either of our initial hypotheses.
So, let’s get more granular, and look at the raw stats in detail.
Now let’s look at the raw numbers in tabular form and as a bar chart:

Table of key results

Bar chart of final banked gains across strategies
Key Observations:
· Baby’s final portfolio value beat Cowen by nearly $60,000
· Baby banked $475,000, as compared to Cowen’s not-quite- $100,000 of banked gains.
· Baby banked 100% of its gains. Cowen has banked approx. 24%
· On an invested total of approx. $105,500, Baby did a 351% (4.5x) return over the period. Cowen did a 294% return (3.94x)
· Crucially, of the $105,450 that Cowen invested, only $99,000 is banked. So, amount actually banked is less than total amount invested
· Baby’s maximum drawdown was 15%. As compared to Cowen’s maximum drawdown of nearly 35%.
· Cowen’s DCA strategy involves a lot of trading- 1162 buys and 4 sells over the period, as compared to Baby which traded only 40 times – an equal number of buys and sells.
· Blindly DCA-ing had a maximum drawdown (nearly 70%) which was twice as bad as Cowen’s Risk Model’s maximum drawdown, but nearly 5x worse than Baby.
· Blindly DCA-ing came within $35,000 of Cowen’s final portfolio value. Cowen therefore only managed to beat another free, simple, easy approach by approximately 9% over the 5.5-year experiment time period
Conclusions
Baby’s First Trading Strategy:
o Finished with a higher portfolio value than Cowen ($475k vs $415.6k). On raw final PnL, Baby was the clear winner
o Banked nearly 5x as much as Cowen ($475k vs $99k). On banked gains, Baby did a total demolition job on Cowen
o Managed risk (as measured by maximum drawdown) nearly 2.5x better than Cowen (15% vs 35%) and nearly 5x better (15% vs 69%) than Blindly DCA-ing. Baby managed risk like a pro: a 4.5x return with a max drawdown of 15% is a stunning performance, by any measure
o Achieved a ROI that was significantly higher than Cowen (351% vs 294%) and Blindly DCA-ing (351% vs 265%).
o Did all of this whilst trading 30 times less than Cowen (40 trades vs 1166).
Not hitting the 0.95 risk level KILLED Cowen’s trading strategy. The fact that 0.95 risk was never hit was both a shocking revelation for the middle-of-the-road investor, but on further investigation (which we touch on below), should have come as no surprise at all to anyone who’s looked under the hood of how Cowen’s model is built.
We can now, by…
Checking back against our initial hypotheses, which were that Cowen’s model should deliver us:
1. More banked gains than Baby’s First Trading Strategy
2. A smaller maximum drawdown than Baby’s First Trading Strategy
Say that…
We have invalidated both 1 and 2 because we have definitively seen that Cowen banked less money than Baby and Cowen’s model provably managed risk significantly worse than Baby.
Revealed: Simplicity Beat Pseudo - Quant
The fact that a basic 140 - day simple moving average strategy beat a $130/month model isn’t some statistical fluke. An 848-day winning streak is not fluke. It’s a brutal lesson in the difference between clarity and complexity.
To be clear, we are drawing a distinction between actual quant strategies (which are based on Expected Value, EV. And backtested and walked forward on out-of-sample data, ruthlessly assessed against strict confidence internals) vs. pseudo-quant strategies – which is what Cowen’s model is.
Cowen’s model - despite its polished veneer - Cowen’s model is built on a foundation of log regression curves, data aggregation, and normalized risk scores. Sounds “actual quant,” but it’s really just dressing up past behavior and projecting it forward. Crypto doesn’t respect that kind of logic. No market does. And never would or will it.
Because crypto doesn’t simply revert to the mean - it spikes, trends, dies, and resurrects. It’s volatile, reflexive, and full of discontinuities. It doesn’t fit into neat little regression curves which can be aggregated with on-chain data and social hype, normalized and then converted to a “Risk Score” between 0 and 1.
Edge doesn’t come from complexity or fancy words or endless hours of chart- gazing.
Edge comes from EV - Expected Value - applied consistently and decisively.
Overly complex systems often suffer from overfitting, lag, and false confidence. They lull the user (or, in this case, thousands of paying subscribers) into trusting the model instead of sharpening their decision-making.
Most people who pay for these regression-based models aren’t buying alpha - they’re buying reassurance. They’re paying to feel safe. To believe that someone has smoothed out the chaos.
But smoothed-out data doesn’t protect you in real time. It just makes the past look easier than it was. And it makes the future look far easier than it will be.
A good trading system doesn’t need to look or sound smart - it needs to work.
Baby’s First Trading Strategy worked because it was:
Rules - based
Adaptive to trend shifts
Unaffected by noise, narrative, or over-analysis
It didn’t try to predict the bottom. It didn’t pretend to know the future. It didn’t pull up charts and talk over them for 4 hours every week. It simply filtered for directional strength and exited when the market turned.
A simple trading model like baby’s First Trading Strategy may not beat an actual quant model, but it will beat a pseudo - quant model like Cowen’s.
Final Takeaway: The Real Cost of Complexity
You’re not just paying $130 a month.
You’re paying in missed trades, late exits, non - exits, and the emotional cost of trusting a model that never delivered.
You’re paying with your capital. And worse - with your conviction.
A system that looks complex but fails to adapt costs far more than a monthly fee. It breeds hesitation, doubt, and bad decisions. You start second-guessing yourself. You hold through drawdowns because “the model says it’s low risk.” You chase entries because “we’re in the green zone.” And just like that, you’re no longer trading - you’re outsourcing your brain to a line on a chart.
And this was for Bitcoin – the flagship crypto for which Cowen’s model should work best, given that it’s the crypto that we have most data for. Whilst our experiment did not extend beyond Bitcoin, our hypothesis is that if Cowen’s model failed for the crypto which Cowen’s model is most confident in modelling, it will perform even worse for cryptos with less price history. Perhaps that’s an experiment for another time.
This note, and all the notes that you’ll ever see published on our website exist for one reason:
To prove that real edge comes from probabilistic, adaptive, expected-value-based thinking.
Not from trendlines. Not from regression bands. Not from someone’s chart that “worked well in backtests.”
So the next time someone shows you a smoothed-out graph with a $130/month subscription tag…
Ask them: “How much EV does this give me today?”
Want to see what edge-based trading actually looks like?
Check out the EdgeVector Line - where EV, Game Theory, stochastic calculus and trading discipline meet.
How To Run This Experiment For Yourself.
All necessary data for Benjamin Cowen's Risk Metric levels are available via a Premium Membership to his 'Into the Cryptoverse' analytics platform. To replicate this comparative backtest, you can construct a spreadsheet (or use Python/other tools) with the following data columns for the period starting September 20th, 2019:
Date: Daily date.
Cowen Risk Metric: The 0-1 Risk level obtained from the ITC Premium platform for each date.
BTC Close Price: Daily Closing Price for BTC/USD (e.g., from TradingView's Coinbase feed).
Daily Investment ($): Calculated based on the Cowen Risk Metric for that day using the 'Risk Profile' rules (e.g., $50 for risk 0.4-0.499, $100 for 0.3-0.399, ... $250 for 0-0.099). No investment if Risk > 0.5.
Daily BTC Acquired (Risk DCA): Daily Investment ($) / BTC Close Price * (1 - 0.0015). (Applies a 15bp fee).
Cumulative BTC Held (Risk DCA): Running total of Daily BTC Acquired.
Partial Sell Trigger: Flag indicating if Cowen Risk Metric crossed thresholds (0.65, 0.75, 0.85, 0.95).
BTC Sold (Risk DCA): Calculate BTC sold based on trigger (10% of held BTC at 0.65, etc.). Remember to apply a 15bp fee to the sale proceeds.
Gains Banked ($) (Risk DCA): Running total of USD realized from partial sales (net of fees).
Market Value Held BTC ($) (Risk DCA): BTC Close Price * Cumulative BTC Held (Risk DCA).
Total Equity ($) (Risk DCA): Market Value Held BTC ($) (Risk DCA) + Gains Banked ($) (Risk DCA). (Assumes initial capital is deployed via DCA sums, adjust if using an initial capital base).
Blind DCA Daily Amount ($): The constant daily investment amount ($52.75 in our test, calculated ex-post to match total capital invested by the Risk DCA strategy over the full period for comparison).
Daily BTC Acquired (Blind DCA): Blind DCA Daily Amount ($) / BTC Close Price * (1 - 0.0015).
Cumulative BTC Held (Blind DCA): Running total of Daily BTC Acquired (Blind DCA).
Market Value Held BTC ($) (Blind DCA): BTC Close Price * Cumulative BTC Held (Blind DCA).
The data for the 'Baby's First Trading Strategy' (Buy BTC when Daily Close > 140-Day SMA, Sell BTC when Daily Close < 140-Day SMA) can be obtained using the BTC Close Price data from TradingView. Apply a 15bp fee on both buys and sells. To ensure a fair capital comparison, the amount invested on each MA Buy signal was matched to the total capital deployed by the Risk DCA strategy up to that point. The resulting trades table looks like this:

The “additional tranches” are the cash injections (“layering”) which ensure that on any given day that a “buy” trade is executed with Baby’s First Trading Strategy, it is working with the same amount of capital as has been invested with Cowen’s model up to that point.